Translate this page into:
Detection of circulating Influenza A and B virus by real-time reverse transcriptase polymerase chain reaction at a tertiary care center in Chennai, Tamil Nadu, India
*Corresponding author: Dr. Padma Srikanth, Department of Microbiology, Sri Ramachandra Institute of Higher Education and Research, Chennai, Tamil Nadu, India. padmasrikanth@sriramachandra.edu.in
-
Received: ,
Accepted: ,
How to cite this article: NKatta D, Gopalakrishnan K, Barani R, Reju S, Thomas RK, Arthur P, et al. Detection of circulating Influenza A and B virus by real-time reverse transcriptase polymerase chain reaction at a tertiary care center in Chennai, Tamil Nadu, India. Sri Ramachandra J Health Sci 2022;2:23-8.
Abstract
Objective:
The aim of this study was to determine the proportion of influenza-like illnesses (ILIs) caused by influenza A and influenza A H1N1 and to determine the proportion of influenza B in a smaller group of samples with ILIs and influenza A H1N1 negative by qualitative real-time reverse transcriptase polymerase chain reaction (RT-PCR) using TaqMan-based assay at a tertiary health-care center in Chennai, Tamil Nadu.
Material and Methods:
Laboratory samples of participants from all age groups who had ILIs were included in this study. The study was conducted from January 2018 to January 2019 at a tertiary health-care center in Chennai, Tamil Nadu. The sample size of the study was 1755. This is a cross-sectional study. RNA extraction was performed using QIAamp Viral RNA Mini Kit (Qiagen, U.S.A) as per the manufacturer instructions. The assay is a TaqMan®-based real-time detection of circulating novel influenza A H1N1 and H3N2. Real-time PCR for influenza B virus was performed in influenza A H1N1-negative patients using artus Infl/H1 LC/RG RT-PCR kit (Cat 4523003, Qiagen, Germany). Samples that had a crossing threshold value 15–35 cycles were considered positive.
Results:
The majority of the participants were in the pediatric and young adult age group (<30 years) (41%). The incidence of influenza was in the range of 32.34–41% up to 60 years. Beyond 60 years, the frequency of detection reduced to 25.9%, and in those above 71 years, it was 22.3%. About 45.4% (n = 798) were positive for influenza A, of which 32.7% (n = 575) were positive for influenza A H1N1. Both influenza A H1N1 and influenza A other than H1N1 incidence started to rise in September and spiked between October and December. Among patients with persistent ILI, screening for influenza B was done in 48 samples. Among 48 samples, 18% (n = 8) had influenza B.
Conclusion:
The need for increased vaccination is demonstrated through the high influenza A H1N1 positivity rate among pediatric patients with ILIs. Detection of influenza B among influenza A H1N1-negative individuals demonstrates the need for influenza B screening. Incidence of influenza is highest in cooler months. The implementation of vaccination against influenza before the beginning of the cooler seasons could possibly reduce the burden of influenza on the health-care system. The importance of surveillance for the continued screening of influenza could be expanded in the private sector as a majority of the disease burden is observed in that sector.
Keywords
Screening
Reverse transcriptase polymerase chain reaction
H1N1
Influenza
INTRODUCTION
Acute respiratory infections are the most common cause of morbidity and mortality across all age groups. According to the World Health Organization (WHO) Global Health estimates, lower respiratory infections are the fourth leading cause of mortality and disability-adjusted life years (DALYs). Globally, more than 1.5 million deaths occur annually from respiratory infections. Influenza virus is one of the most common causes of viral ARIs. The segmented nature of the RNA genome contributes to rapid evolution through high mutation rates, short generation time, and large population. The virus evades the host immune system through mutation that could be positively selected and is passed down to the following generation and further distributed. This virus has been responsible for four pandemics over the past 100 years: 1918 H1N1 Spanish flu 1957 H2N2 Asian flu, 1968 H3N2 Hong Kong flu, and 2009 H1N1 swine flu.
Despite wild waterfowls and other wild birds being the primary reservoir of the influenza virus, it can also be seen in domestic poultry and swine populations.
Hemagglutinin (HA) and neuraminidase (NA) are the two glycoproteins present on the surface that aids in virus adsorption and penetration to host cell, respectively. As mentioned earlier, the segmented RNA virus is prone to undergo genetic reassortment and this reassortment results in differing HA and NA protein combinations. Based on these combinations, influenza viruses can be subtyped into H1N1, H5N1, H5N2, H3N2, H2N2, H3N8, and H7N7.[1] An estimated 5–10% of adults and 20–30% of children are infected with influenza each year resulting in 3–5 million cases of severe disease.[2,3]
The Spanish flu of 1918 occurred when the virus crossed over from birds to humans and killed an estimated 50–100 million people.[4] Subsequently, influenza A H1N1 crossed over from swine to humans and was responsible for the 2009 pandemic. The origin of the viral genetic material was observed to be from three different species: Human, avian, and swine. The virus was first detected in California in a 10-year-old patient and went on to infect approximately 90 million people globally.[5] The total number of deaths due to influenza in 2017 was approximately 500,000 across all ages[6] and was higher among adults >70 years than among children <5 years. Among all ages, an estimated 8.5% of lower respiratory tract infection (LRTI) hospitalizations were due to influenza and it was responsible for 9,459,000 LRTI hospitalizations in 2017. The highest incidence of hospitalization due to influenza was among children <10 and children <5 in 2017, with 2,224,000 admissions.[7]
The different strains of the virus include Types A, B, and C. Influenza C virus is endemic and causes mild or asymptomatic infection. Influenza is more commonly associated with epidemics. Influenza B virus infections account for 23% of all cases of influenza annually. The 1918 Spanish flu can be attributed to influenza A and it claimed the 10 million lives in India.[8-10] Despite the significant annual health and socioeconomic impacts of influenza B, it continues to be overlooked.[11] Due to this continuously changing nature of the virus, it can cause outbreaks that are initially localized before becoming an epidemic and eventually a pandemic.
This study was undertaken to determine the proportion of cases caused by influenza A H1N1 and influenza B (in influenza A H1N1-negative samples) among those presenting with ILIs using qualitative real-time reverse transcriptase polymerase chain reaction (RT-PCR) using TaqMan-based assay.
MATERIAL AND METHODS
Study design
This is a descriptive and cross-sectional study. The study was conducted between January 2018 and January 2019 in Sri Ramachandra Medical Centre, Chennai. The Institutional Ethics Approval was obtained before the conduct of study from the Institutional Ethics Committee CSP/18/APR/68/104.
Sample
Laboratory samples (oropharyngeal swab) of participants of all age groups with influenza-like illnesses (ILIs) were analyzed in the study.
A total of 1755 samples were analyzed and clinical details such as ILI information and other manifestations (fever, cough, chills/rigor, sore throat, breathlessness, fatigue, vomiting, diarrhea, etc.) were extracted from the clinical proforma.
RNA extraction
RNA extraction was performed from laboratory samples by spin column-based extraction method using QIAamp Viral RNA Mini Kit (Qiagen, U.S.A). The extraction was performed as per manufacturer instructions with known positive and negative controls to ensure quality of extraction. Eluted RNA was used as template for real-time RT-PCR using TaqMan chemistry.
Real-time PCR for the detection of Influenza A H1N1, Influenza A other than H1N1 and H3N2
The assay is a TaqMan®-based real-time detection of circulating novel influenza A H1N1 and H3N2. Sequences of influenza A, influenza A H1N1, and H3N2 (forward and reverse primer) were used from the CDC protocol. (CDC APRIL 28, 2009) TaqMan dual-labeled probes sequences were tagged with 6-carboxyinfluenzaorescein (FAM) reporter and non-fluorescent quencher coupled with minor grove binder.
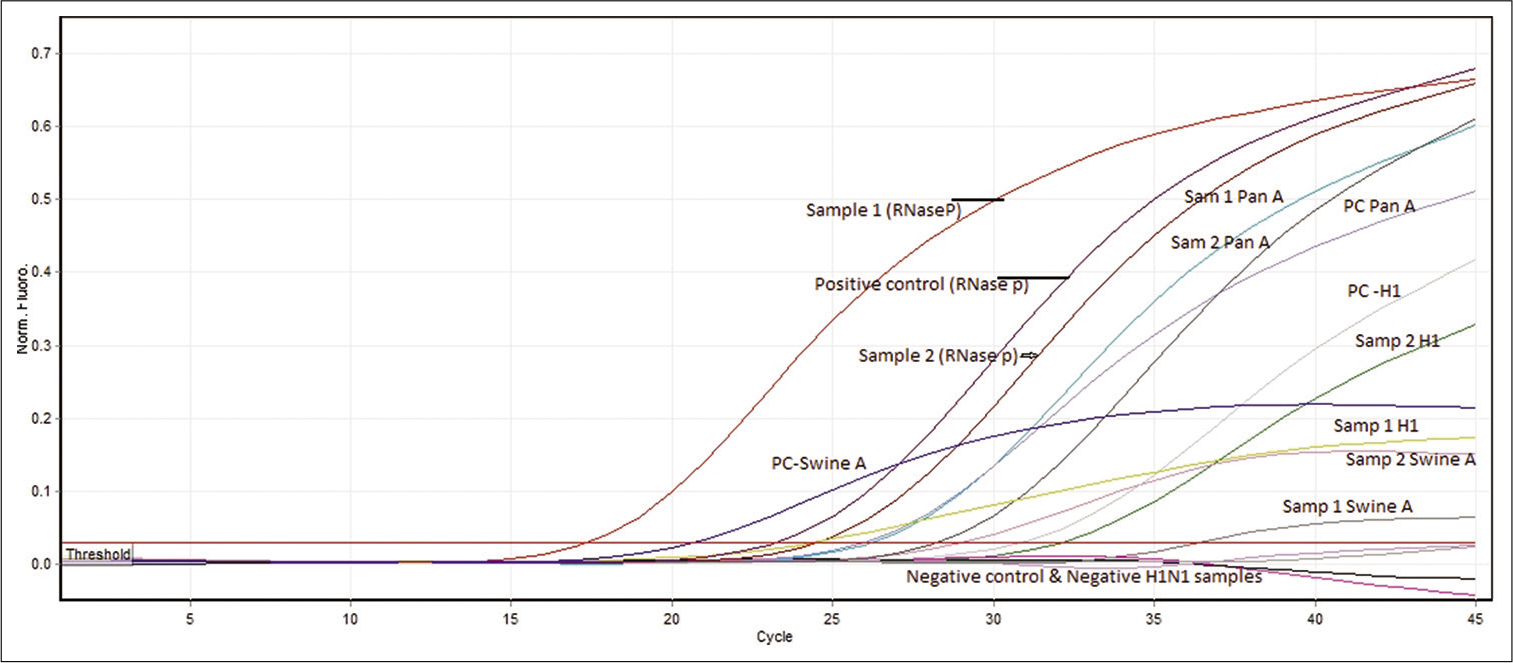
Assay mix preparation: Real-time PCR was performed with 5 µl of extracted RNA. The constituents of the PCR amplification mix (Ambion AgPath-ID One Step RT-PCR Kit) include 12.5 µL of RT-PCR buffer, 0.5 µL of each forward, reverse primer and probe, and 1 µL of reverse transcriptase enzyme. Similar cycling condition and PCR amplification premix were used for pandemic influenza A, swine influenza, influenza A H1N1 (swine H1N1), and RNase P. All PCR reactions were performed using Rotor-Gene Q genetic analyzer (Qiagen, Rotor-Gene Q software version 2.3.1). To check the RNA integrity in throat swabs, RNase P was used. Cycling conditions of the real-time PCR were RT activation at 50°C for 30 min, 95°C for 10 min for RT inactivation, and 45 cycles of 95°C for 15 s and 55°C for 30 s. Samples that had a crossing threshold value 15–35 cycles were considered positive [Figure 1].

- Detection of pandemic influenza A and RNase P as internal control was performed by real-time PCR using TaqMan-based CDC protocol. Test sample with specific sigmoidal amplification with crossing threshold value (Ct – 15–35) was considered as positive. Only samples with presence of RNase P (internal control) with sigmoidal amplification were taken to validate the assay and reported either negative or positive for any of the specific target genes.
Real-time PCR for the detection of influenza B
Laboratory samples that tested negative for influenza A H1N1 were retested for influenza B for using artus Infl/ H1 LC/RG RT-PCR kit (Cat 4523003, Qiagen, Germany). PCR amplification and interpretation were performed as per manufacturer instructions (Rotor-Gene Q software version 2.3.1). Samples that had a crossing point value 15–35 cycles with sigmoid amplification were considered positive.
Data analysis
Real-time Ct values between each group were analyzed (Chi-square) using MedCalc. Version 20.013. Ct value was analyzed in 264 samples (171 non-ICU, 69 outpatients, and 24 ICU).
RESULTS
Demographic profile
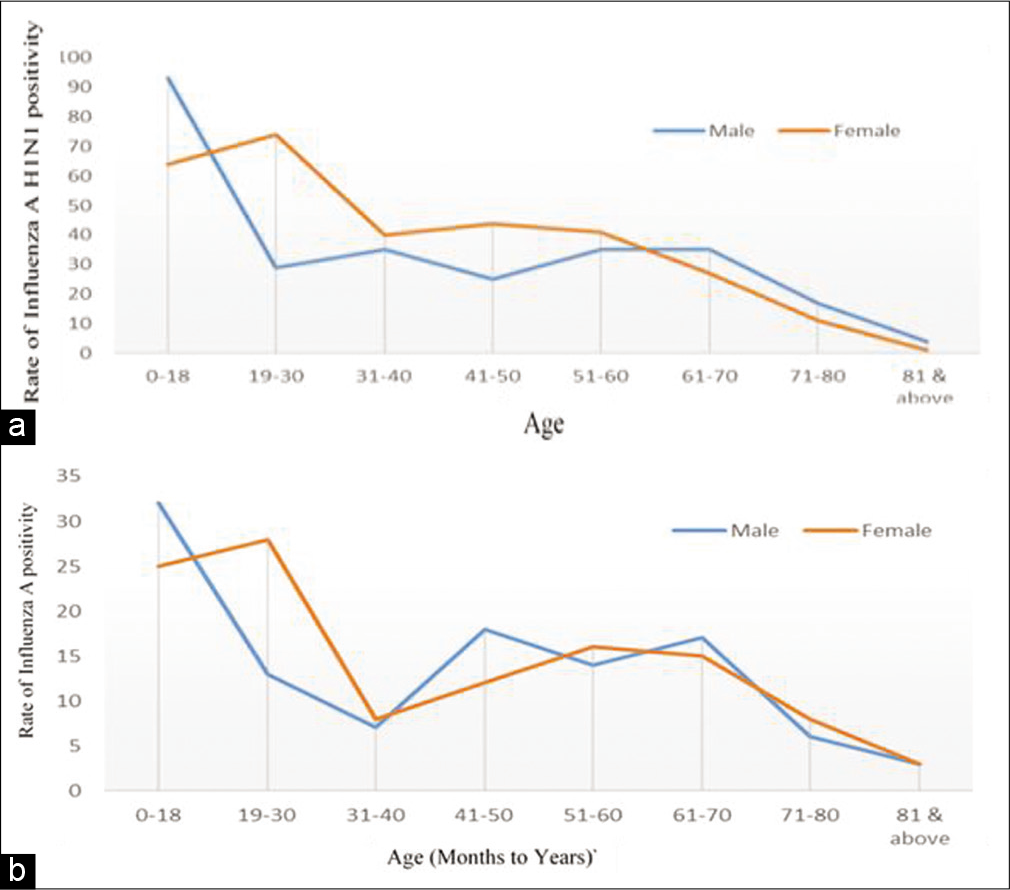
The demographic profile of the study participants is displayed in Figure 3a and 3b. A majority of the samples tested were from participants in the pediatric and young adult age group. Incidence of influenza was in the range of 32.34–41% up to the age of 60. Beyond 60 years, the proportion that tested positive reduced to 25.9%, and in those above 71, it was 22.3%.

- Total number of samples and positivity for influenza A H1N1 and influenza A other than H1N1 distribution.

- (a) Rate of influenza A H1N1 among samples by gender. (b) Rate of influenza A other than H1N1 positivity among samples by gender.
Influenza A positivity
Of the 1755 samples tested, 45.5% were positive for influenza A in which 32.7% (n = 575) were positive for influenza A H1N1 [Table 2].
| S. No. | Age distribution of samples | Total number of samples | Influenza A H1N1 positive | Age-wise positivity rate H1N1 (%) | Influenza A other than H1N1 positive | Age-wise positivity rate influenza A (%) |
|---|---|---|---|---|---|---|
| 1. | 0–3 M | 10 | - | 0 | 1 | 10 |
| 2. | 4–6 M | 6 | - | 0 | - | 0 |
| 3. | 7–9 M | 12 | 3 | 25 | - | 0 |
| 4. | 10–12 M | 9 | 2 | 22.22 | 1 | 11.11 |
| 5. | >1–3 Y | 199 | 63 | 31.65 | 24 | 12.06 |
| 6. | 4–6 Y | 119 | 47 | 39.49 | 19 | 15.96 |
| 7. | 7–9 Y | 41 | 20 | 48.78 | 4 | 9.75 |
| 8. | 10–12 Y | 28 | 7 | 25 | 3 | 10.71 |
| 9. | 13–15 Y | 20 | 9 | 45 | 2 | 10 |
| 10. | 16–18 Y | 25 | 6 | 24 | 3 | 12 |
| Total | 470 | 157 | 33.40 | 57 | 12.12 |
| S. No. | Age distribution of samples | Total number of samples | Influenza AL H1N1 positive | Age-wise positivity rate (%) | Influenza A positive | Age-wise positivity rate (%) |
|---|---|---|---|---|---|---|
| 1. | 0–18 | 470 | 157 | 33.4 | 57 | 12.12 |
| 2. | 19–30 | 251 | 103 | 41.03 | 40 | 15.9 |
| 3. | 31–40 | 196 | 75 | 38.26 | 16 | 8.1 |
| 4. | 41–50 | 199 | 69 | 34.67 | 30 | 15 |
| 5. | 51–60 | 235 | 76 | 32.34 | 30 | 12.7 |
| 6. | 61–70 | 239 | 62 | 25.94 | 32 | 13.3 |
| 7. | 71–80 | 112 | 28 | 22.32 | 13 | 11 |
| 8. | 81 and above | 53 | 5 | 9.4 | 7 | 13.2 |
| Total | 1755 | 575 | 32.76 | 225 | 12.8 |
Influenza A H1N1 positivity rate
Among the 1755 samples tested, 45.5% were positive for influenza A, of which 32.7% (n = 575) were positive for influenza A H1N1 and 12.8% (n = 225) for influenza A other than H1N1 [Figure 2 and Table 2]. The highest rate of influenza A H1N1 was observed in the pediatric and young adult group. Among this pediatric group, the predominant influenza A H1N1 positivity rate was found to be among 1–3 years (63%), followed by 39% in 4–6 years, 48% in 7–9 years, 25% in 10–12 years, 45% in 13–15 years, and 24% in 16–18 years [Table 1].
Seasonality of influenza
The seasonal occurrence of influenza A H1N1 was analyzed along with influenza A other than H1N1 [Figure 4]. Both influenza A H1N1 and influenza A other than H1N1 started to rise in September and spike between October and December. No influenza A other than H1N1 was observed between January and August.

- Samples tested for influenza A H1N1 and influenza A other than H1N1 and rate of positivity distribution.
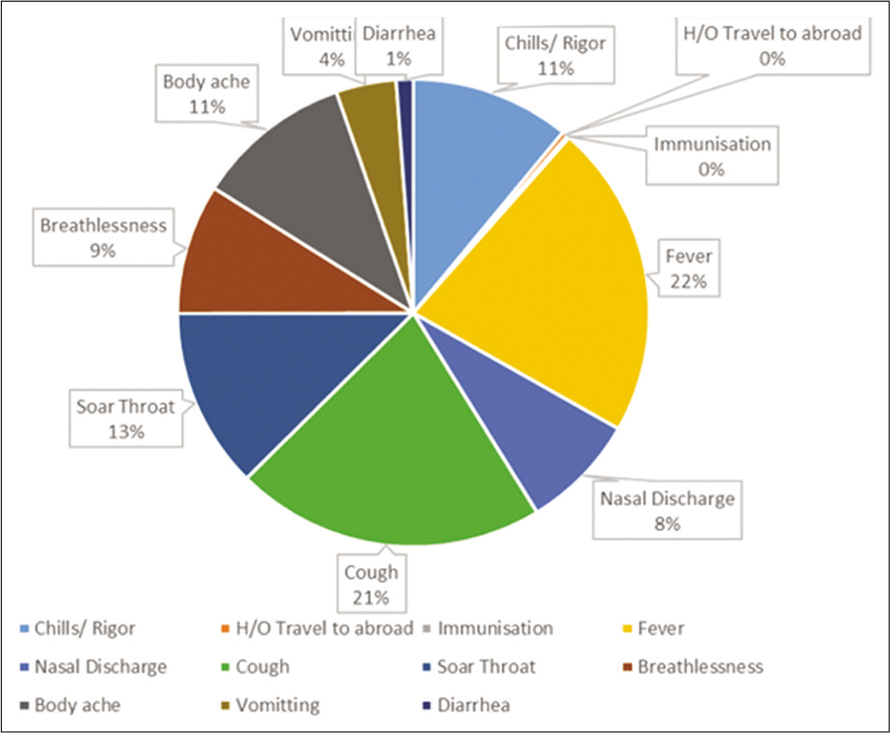
The analysis of ILIs in the clinical proforma showed that fever (22%) was the most predominant symptom followed by cough (21%), sore throat (13%), chills and rigor (11%), body ache (11%), nasal discharge (8%), breathlessness (9%), diarrhea (1%), and vomiting (4%) [Figure 5].
Influenza A H1N1 positivity rate among women in the reproductive age was found to be 41.3% (n = 96); of which 39.5% (n = 38) was observed participants admitted in general ward, 23.9% (n = 23) in labor ward, emergency 3.1% (n = 3), and 1% (n = 1) was seen in ICU.

- Analysis of clinical presentations among study samples with ILI who tested positive for influenza A H1N1.
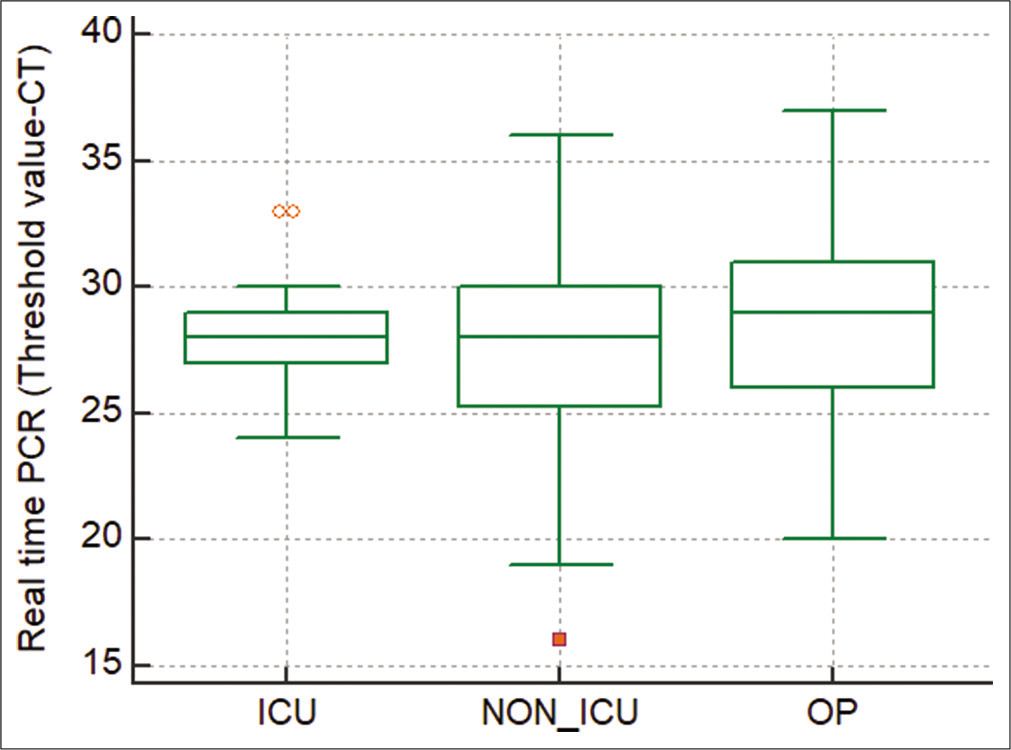
Among samples with influenza A H1N1, real-time PCR threshold value (Ct) was analyzed to screen the disease severity [Figure 6]. Ct value ranged from 24 to 30 Ct in ICU, 16 to 36 Ct in non-ICU, and 20 to 37 Ct in outpatients. Among patients with persistent ILI, screening for influenza B was done in 48 samples. Among 48 samples, 17% (n = 8) had influenza B. Majority of influenza B was detected in the month of October 75% (n = 6). The rest of the two samples had influenza B during March.

- Analysis of threshold value of influenza A H1N1 among ICU and non-ICU patients.
DISCUSSION
The WHO ranks acute respiratory infections as the second leading cause of death worldwide for children <5 and can lead to hospitalization, especially among high-risk groups such as pregnant women and children <2 years.[12] In the developing countries, ILIs are a major cause of illness and death in children. It has been estimated that about 20% of infants born in the developing countries do not live beyond 5 years and 44% of childhood mortality is attributable to ILI as an underlying cause.[13] Individuals <18 years were found to be most vulnerable for the influenza infection.[5]
The highest positivity rate of influenza A including H1N1 was in the pediatric age group and young adult. Since all age groups appear to be affected, the influenza vaccination should be recommended for the most vulnerable groups, including the lower and upper ends of the pediatric and geriatric age groups, respectively, and pregnant women. Influenza is known to contribute to morbidity among young adults and lead to increased DALYs.[14] Influenza A also appears to affect the same age group and this group is vulnerable to other combinations of the reassorted viruses that may emerge every year. Therefore, there is a need for vaccination before the onset of illness. Furthermore, since the burden of disease and mortality is high in pregnant women, the need for appropriate strategies for vaccination to prevent mortality in this group must be undertaken. There are other studies that have demonstrated an increase in incidence in among people older than 65 years of age.[15] However, in this study, we found that the numbers remained uniform across all age groups.
As per global data, influenza is a seasonal disease occurring typically in winter months.[16] In this study, the highest rate of influenza A H1N1(32.7%; n = 575/1755) and 12.8% (n = 225/1755) of influenza A other than H1N1 was seen in October and November. Positivity of influenza A H1N1 and influenza A other than H1N1 decreased to 14.3% (n = 31/216) and 10% (n = 22/216) in December. The temperature in October in Chennai varies from 24°C to 31°C. The temperature in Chennai continues to progressively decrease to a low of approximately 20°C in December/January. The increase in the incidence of influenza during this time could possibly be associated with decrease in temperature and this should be further explored.[17,18] The previous methods of the detection of influenza virus such as hemagglutination assay and hemagglutination inhibition assay were very cumbersome and only focused on the predominantly circulating strain of the virus.[19] Influenza B has been overlooked for the past many years as a result of prior assays focusing on the dominant circulating strain. In summer months, the virus is not detected within the population. This could be due to the fact that influenza is an RNA virus and RNA viruses tend to be more fragile and susceptible to heat. Several direct and/or indirect environmental factors, possibly increased temperature and humidity among others, are purported to drive the seasonality of influenza include indoor crowding during cold and wet seasons and decreased host immunity due to decrease in Vitamin D synthesis from lack of sunlight during winter months.[20]
Analysis of Ct value between ICU and non-ICU samples revealed that Ct value is inversely proportional to the viral load, with lower Ct value corresponding to higher viral load. Ct value has no impact on disease severity and cannot be used to determine the course of illness. Among ICU patients, the viral load was comparatively less, that is, Ct value was higher. As these patients had manifestations, the following cytokine-induced storm which follows disease progression resulted in acute respiratory distress syndrome (ARDS). The non-ICU patients started earlier treatment and the chance of viral load is less compared to ICU patients. Most cases of ARDS are associated with influenza A. However, there are reports of ARDS that has been associated with influenza B as well.[21]
There is no information about whether the circulating strains were H3N2, H5N9, etc. A limitation of this study was that the other influenza A strains were not further subtyped. It would be worthwhile for the surveillance network to be expanded in the private sector as a majority of the disease burden is observed in that sector.
CONCLUSION
The need for increased vaccination is demonstrated through the high influenza A H1N1 positivity rate among pediatric patients with ILIs. Screening for influenza B among samples who were negative for influenza A H1N1 demonstrated 18% positivity rate. The implementation of vaccination against influenza before the beginning of the cooler seasons could possibly reduce the burden of influenza on the health-care system. This study also demonstrates the importance of surveillance for the continued screening of influenza.
The need for increased vaccination is demonstrated through the high influenza A H1N1 positivity rate among pediatric patients with ILIs. Detection of influenza B among influenza A H1N1-negative samples demonstrates the need for screening influenza B. The importance of surveillance for the continued screening of influenza is also demonstrated through this study.
Acknowledgements
We gratefully acknowledge the assistance provided by Prof. Dr. Usha Rani, SRIHER in the conduct of the study. We also thank Dr. Monika Mani, currently on leave as post doctoral fellow in John’s Hopkins, USA for her assistance.
Declaration of patient consent
Patients’ consent not required as patients’ identity is not disclosed or compromised.
Financial support and sponsorship
Nil.
Conflicts of interest
All authors have no financial conflict of interest and one of the authors is associate editor of the journal.
References
- Evolution of influenza a virus by mutation and re-assortment. Int J Mol Sci. 2017;18:1650.
- [CrossRef] [PubMed] [Google Scholar]
- 2021. Available from: https://www.who.int/teams/health-product-policy-and-standards/standards-and-specifications/vaccinesquality/influenza [Last accessed on 2021 Oct 01]
- [Google Scholar]
- 1918 influenza: The mother of all pandemics. Emerg Infect Dis. 2006;12:15-22.
- [CrossRef] [Google Scholar]
- Key Facts about Influenza (Flu) 2021. Atlanta, Georgia: Centers for Disease Control and Prevention; Available from: https://www.cdc.gov/flu/about/keyfacts.htm [Last accessed on 2021 Oct 01]
- [Google Scholar]
- Global mortality associated with seasonal influenza epidemics: New burden estimates and predictors from the GLaMOR project. J Glob Health. 2021;9:20421.
- [CrossRef] [PubMed] [Google Scholar]
- 2017 an analysis for the global burden of disease study 2017. Lancet Respir Med. 2018;7:69-89.
- [Google Scholar]
- 2020. Atlanta, Georgia: Centers for Disease Control and Prevention; Available from: https://www.cdc.gov/flu/pandemic-resources/1918-pandemic-h1n1.html [Last accessed on 2021 Oct 01]
- [Google Scholar]
- Available from: https://scroll.in/article/966655/a-study-maps-the-spread-and-decline-of-the-1918-spanish-flu-in-india [Last accessed on 2021 Oct 01]
- [Google Scholar]
- Burden of influenza B virus infection and considerations for clinical management. Antiviral Res. 2021;185:104970.
- [CrossRef] [PubMed] [Google Scholar]
- Influenza B viruses: Underestimated and overlooked. Microbiol Aust. 2021;42:110.
- [CrossRef] [Google Scholar]
- Available from: https://www.who.int/news-room/fact-sheets/detail/influenza-(seasonal) [Last accessed on 2022 Jun 18]
- [Google Scholar]
- Influenza vaccine: An effective preventive vaccine for developing countries. Hum Vaccines Immunother. 2012;8:675-8.
- [CrossRef] [PubMed] [Google Scholar]
- The disease burden of hepatitis B, influenza, measles and salmonellosis in Germany: First results of the burden of communicable diseases in Europe study. Epidemiol Infect. 2014;142:2024-35.
- [CrossRef] [PubMed] [Google Scholar]
- Study Shows Hospitalization Rates and Risk of Death from Flu. 2019. Atlanta, Georgia: Centers for Disease Control and Prevention; Available from: https://www.cdc.gov/flu/spotlights/2018-2019/hopitalization-rates-older.html [Last accessed on 2022 Jun 18]
- [Google Scholar]
- A narrative review of influenza: A seasonal and pandemic disease. Iran J Med Sci. 2017;42:2-13.
- [Google Scholar]
- Weatherbase. Available from: http://www.weatherbase.com/weather/weather.php3?s=97234&cityname=Chennai-India [Last accessed on 2021 Oct 04]
- [Google Scholar]
- Available from: https://www.meteoblue.com/en/weather/historyclimate/climatemodelled/chennai_india_1264527 [Last accessed on 2021 Oct 04]
- [Google Scholar]
- Detection of the influenza virus yesterday and now. Acta Biochim Pol. 2014;61:465-70.
- [CrossRef] [PubMed] [Google Scholar]
- Estimating the burden of 2009 pandemic influenza A (H1N1) in the United States (April 2009-April 2010) Clin Infect Dis. 2011;52(Suppl 1):S75-82.
- [CrossRef] [PubMed] [Google Scholar]
- Severe respiratory failure associated with influenza B virus infection. Respirol Case Rep. 2015;3:61-3.
- [CrossRef] [PubMed] [Google Scholar]


